After choosing the room in Episode 1 and learning the basics of Room EQ Wizard (REW) in Episode 2, it’s finally time to take the first real measurements.
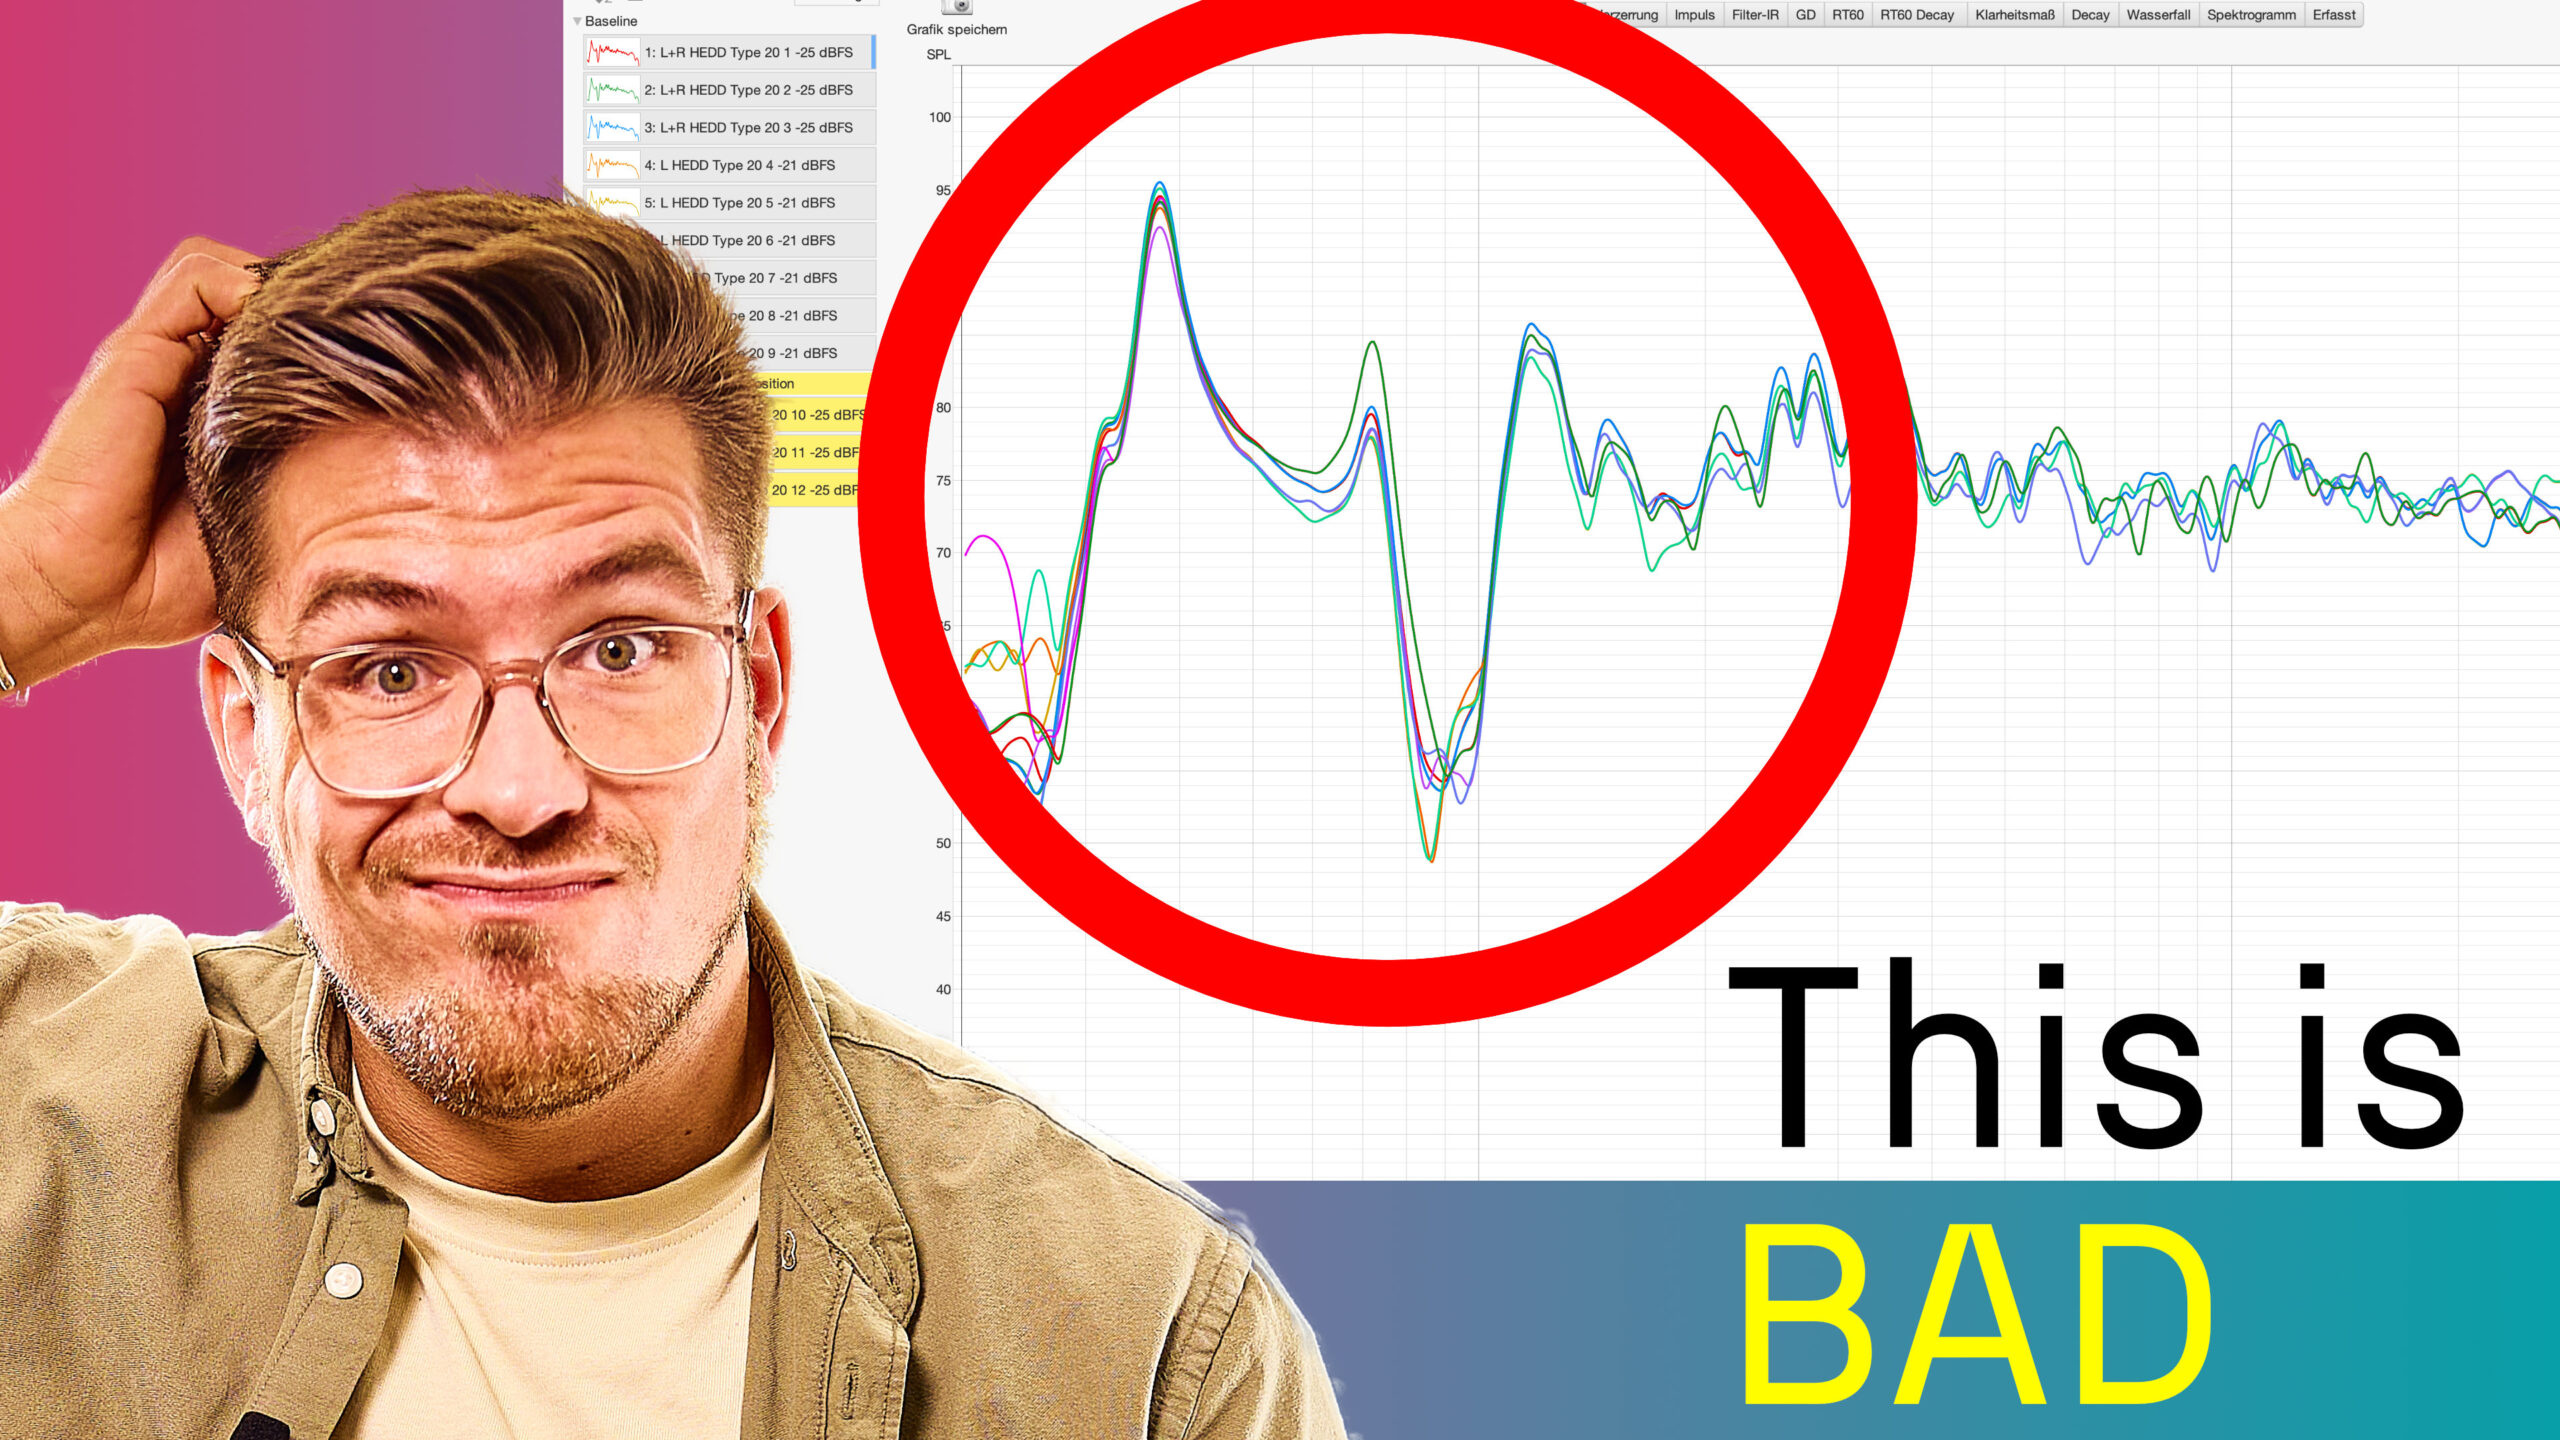
And honestly?
They’re bad.
But that’s actually exactly what I was hoping for.
The purpose of this series isn’t to showcase a perfect studio from day one. The goal is to document the entire process of improving a real-world home studio and to see what kind of results can be achieved through proper speaker placement, acoustic treatment, and systematic optimization.
To do that, we first need a baseline.
Why A Baseline Measurement Matters
Before moving speakers, installing bass traps, or spending money on acoustic treatment, I wanted to know exactly where the room currently stands. Without a baseline, it’s impossible to determine whether a change actually improves the room or simply makes it different.
These first measurements serve as the reference point for everything that follows in this series.
Every improvement we make later can be compared directly against these results.
Studio Setup
The measurements were performed in my current home studio using the following equipment:
- HEDD Type 20 monitors
- LF Extend mode enabled
- Earthworks M23R measurement microphone
- Audio interface with phantom power
- Room EQ Wizard (REW)
- Sessiondesk Quintav workstation
- Untreated room
- Listening position based on practical desk placement
One important detail is that the HEDD Type 20s were operating in LF Extend mode throughout all measurements.
This is significant because LF Extend allows the speakers to reproduce considerably deeper bass frequencies than their standard setting. While this is fantastic for monitoring, it also means the room’s acoustic issues become far more obvious.
Many smaller monitors naturally roll off below 50–60 Hz, effectively hiding some room problems. The HEDDs don’t hide anything. Every room mode, cancellation, and resonance becomes immediately visible.
In other words, the speakers are not the limiting factor here—the room is.
Measurement Procedure
To establish a reliable baseline, I wanted the measurement process to be as consistent and repeatable as possible.
The Earthworks M23R measurement microphone was positioned at the listening position at approximately ear height and angled according to Earthworks’ recommendations.
Before taking any measurements, I calibrated the playback level using the NIOSH Sound Level Meter App on my smartphone. While a dedicated SPL meter would provide the highest degree of accuracy, the NIOSH app is widely regarded as one of the most reliable smartphone-based SPL measurement tools available.
The monitoring level was adjusted to approximately 75 dB SPL at the listening position.
This level is commonly used for home studio measurements because it provides a good balance between measurement accuracy and listening comfort.
Once the level was set, REW generated a logarithmic sine sweep through the speakers covering the entire audible frequency spectrum.
Using these sweeps, REW calculates:
- Frequency Response
- Waterfall Plots
- Decay Times
- Room Modes
- Impulse Response
- Phase Information
To better understand the room’s behaviour, I measured:
- Left speaker only
- Right speaker only
- Both speakers together
I also repeated measurements from slightly different listening positions to evaluate how strongly the room reacts to small positional changes.
The goal wasn’t to achieve perfect results. The goal was to create a documented and repeatable baseline that can be compared against future improvements throughout this series.
What The Measurements Revealed
The results were eye-opening. Looking at the frequency response, several significant issues became immediately obvious.
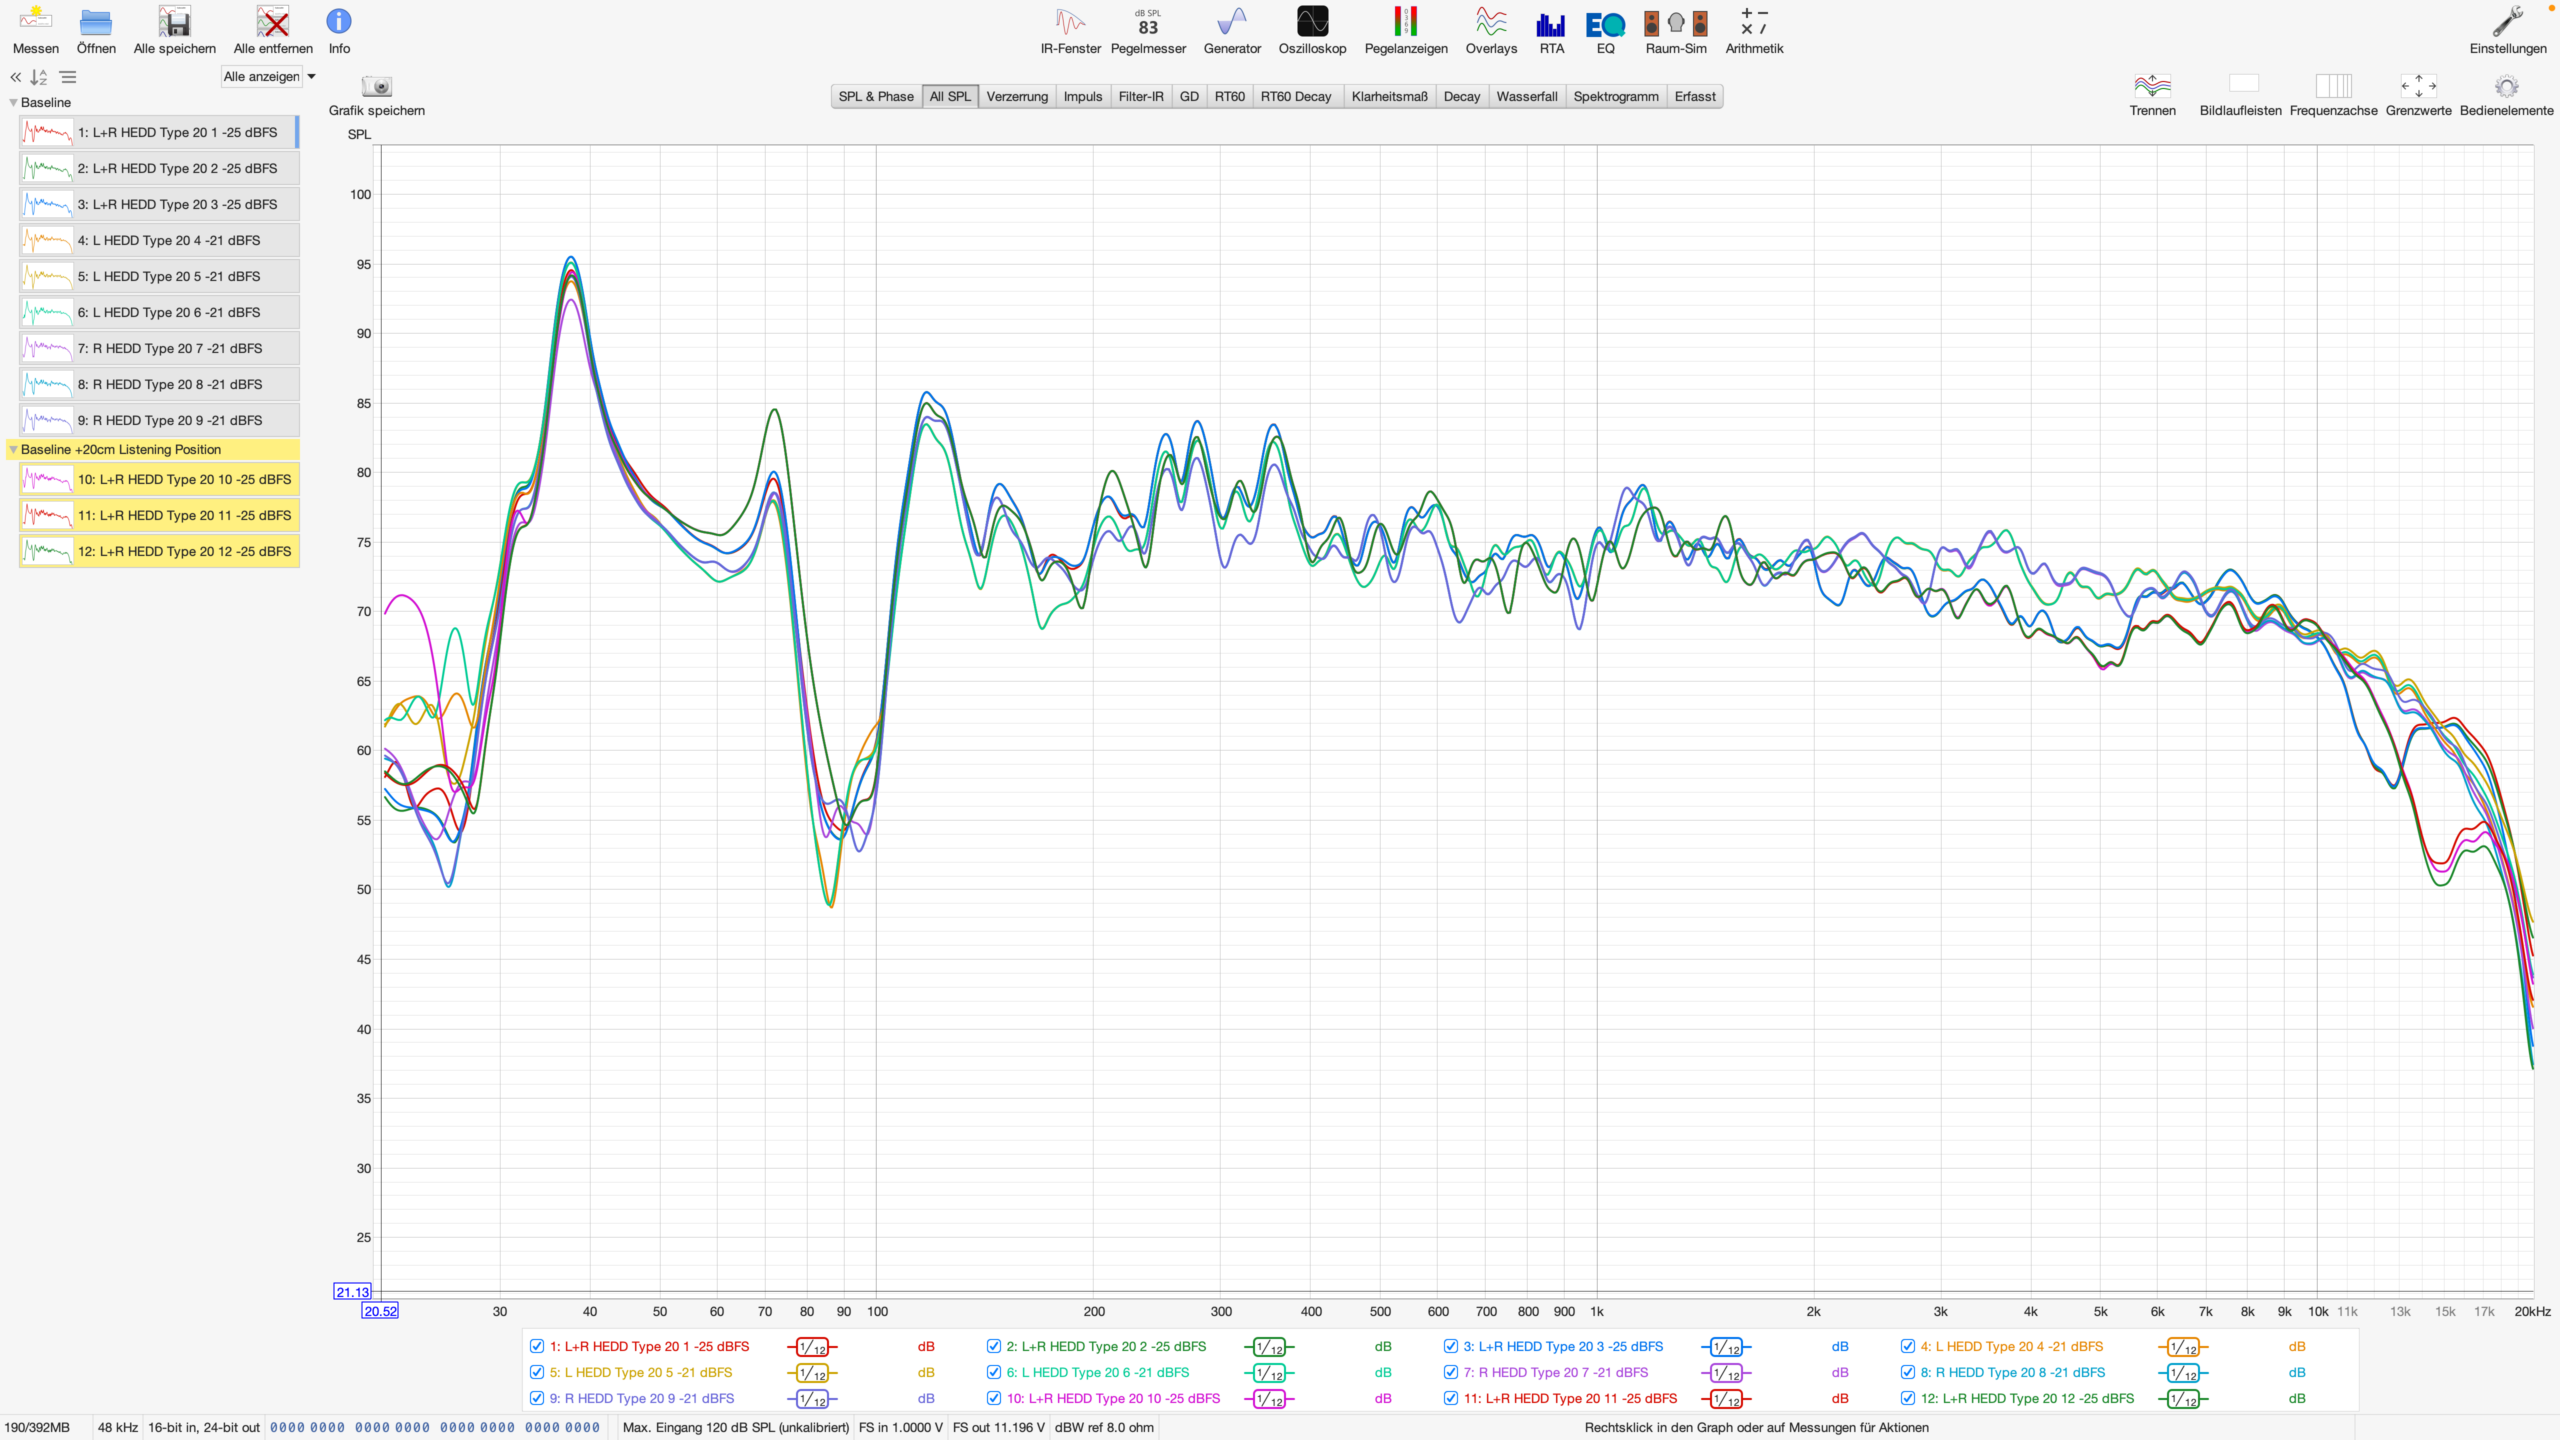
Severe Low-End Problems
The bass response showed large peaks and dips throughout the low-frequency range.
This is completely normal in small rooms.
Low frequencies interact strongly with the room boundaries, creating standing waves, commonly referred to as room modes.
The result is a bass response that varies dramatically depending on frequency.
Some notes become exaggerated.
Others almost disappear entirely.
For mixing and production work, this creates a serious problem because you’re no longer hearing an accurate representation of your music.
Several deep nulls appeared in the measurements, making certain bass frequencies almost impossible to judge reliably.
The “Don’t EQ This” Lesson
One of the most important lessons when interpreting room measurements is understanding that not every problem should be fixed with EQ.
A deep dip in a frequency response graph often isn’t caused by the loudspeaker itself.
Instead, it’s usually caused by acoustic cancellation within the room.
Boosting these frequencies with EQ rarely solves the problem.
It simply forces the speaker to work harder while the cancellation remains.
This is one of the biggest misconceptions surrounding room correction software.
Many room problems require physical solutions such as:
- Better speaker placement
- Better listening position
- Acoustic treatment
Not more EQ.
Speaker Placement Could Be A Major Factor
One particularly interesting observation was a significant dip that may be related to the current speaker positioning.
At this stage, it’s still too early to draw final conclusions.
However, one of the most fascinating aspects of room acoustics is how dramatically the frequency response can change with relatively small movements.
Moving a speaker just a few centimetres can sometimes produce larger improvements than expensive acoustic treatment.
This is why speaker positioning should always be optimized before purchasing treatment.
Why Measuring Individual Speakers Matters
Many beginners only measure both speakers together.
While that can be useful, it often hides important information.
For this reason, I measured:
- Left speaker only
- Right speaker only
- Both speakers together
This approach helps identify whether a problem originates from:
- The room itself
- A specific speaker location
- Stereo interactions between both speakers
This information becomes incredibly valuable later when making placement adjustments.
Looking Beyond Frequency Response
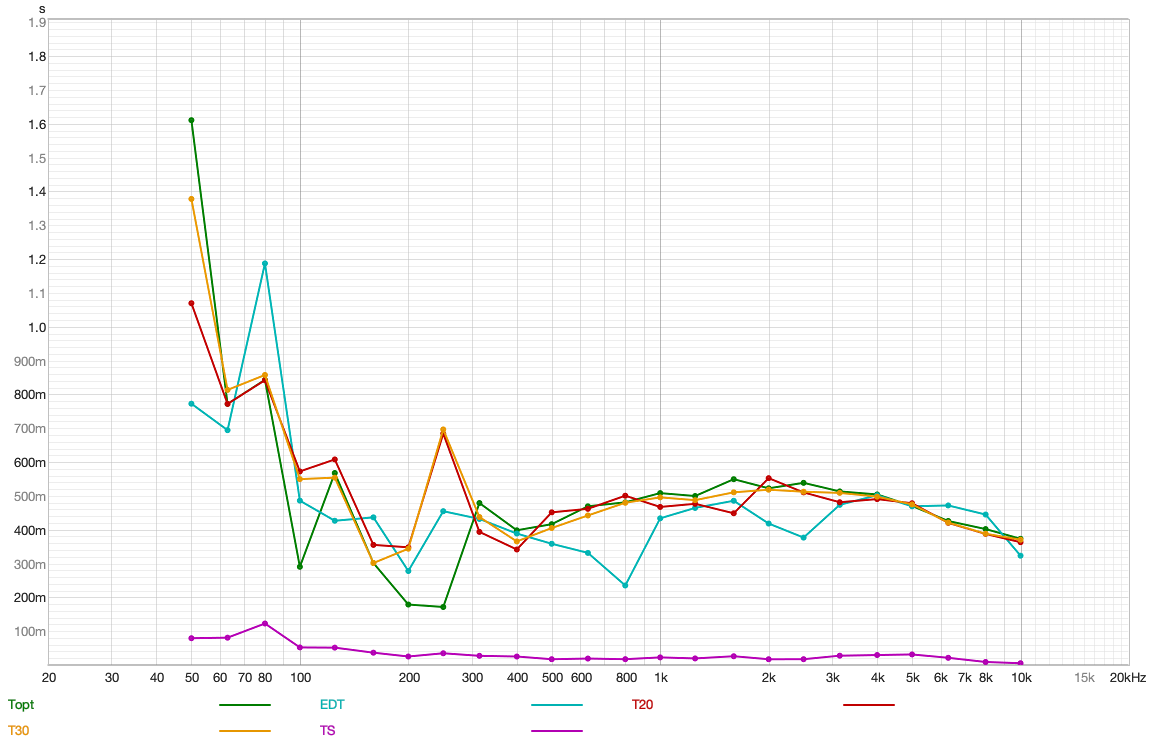
When people first discover REW, they often focus entirely on the frequency response graph. However, frequency response is only part of the story.
Equally important is what happens over time. This is where the waterfall plot becomes extremely useful. The waterfall graph shows how long frequencies continue ringing after the original signal has stopped.
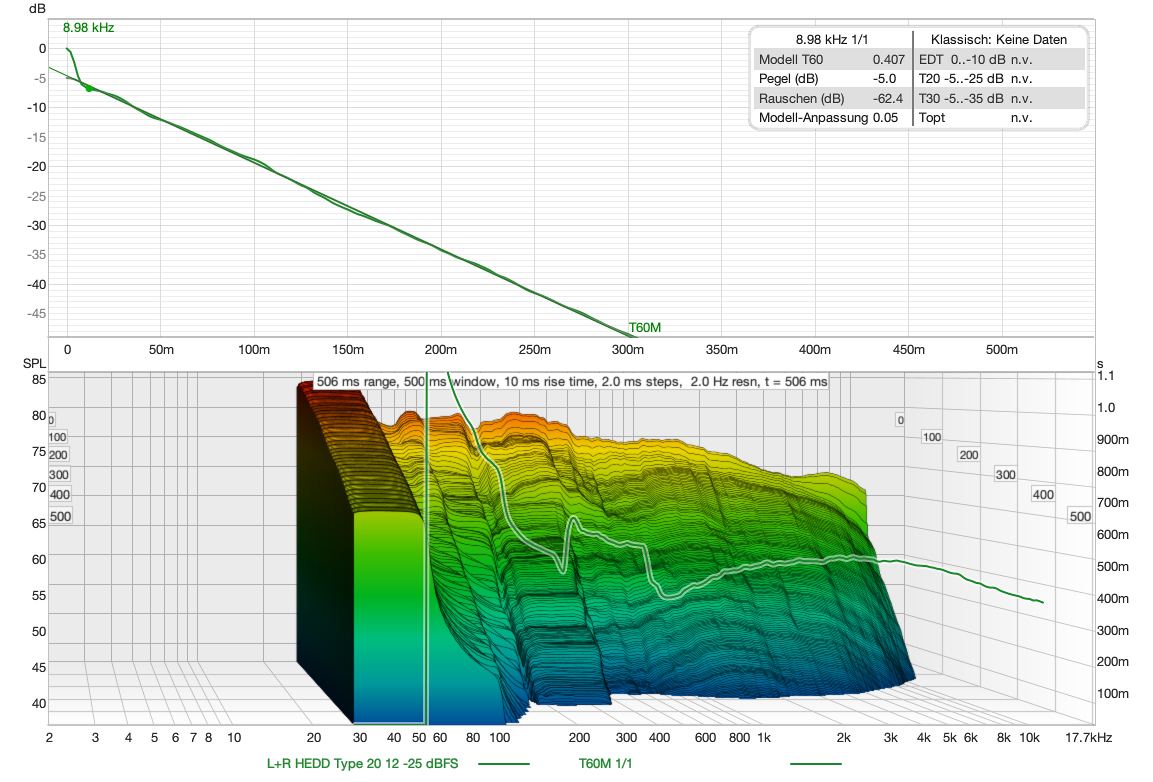
In untreated rooms, low frequencies often linger for hundreds of milliseconds longer than they should.
This excessive decay causes:
- Reduced clarity
- Muddy low-end reproduction
- Less precise stereo imaging
- Poor translation to other playback systems
Acoustic treatment isn’t only about achieving a flatter frequency response.
It’s also about improving time-domain performance.
The 20 cm Experiment
One of the most surprising discoveries came from moving the measurement position approximately 20 centimetres backwards from the original listening position.
Visually, the change was almost insignificant.
Acoustically, however, the room reacted noticeably.
The low-frequency response changed immediately, demonstrating just how sensitive small rooms are to listening position.
This experiment perfectly illustrates why proper positioning should always be the first step in any room optimization process.
It’s one of the few improvements that costs absolutely nothing.
Why Bad Measurements Are Good News
At first glance, these measurements might seem discouraging. But from the perspective of this project, they’re actually fantastic.
If the room already measured well, there would be very little to improve and even less to learn. These results clearly show where the problems are. More importantly, they provide an objective reference point that allows us to track every improvement moving forward.
The worse the baseline, the more meaningful the transformation becomes.
And judging by these first measurements, we have plenty of work ahead of us.
What’s Next?
Now that we’ve established a proper baseline, the real optimization process can begin.
In the upcoming episodes we’ll explore:
- Speaker positioning
- Listening position optimization
- Early reflection treatment
- Bass trapping
- Room mode management
- Real-world acoustic treatment solutions
- Before-and-after measurements
The goal isn’t perfection.
The goal is understanding what actually makes a difference in a home studio.
And based on these first measurements, the journey is going to be very interesting.
Watch the full video on the Phable YouTube channel:
https://www.youtube.com/@phable
Because before buying more gear, it’s worth making sure you can actually hear what you already own.